

TL;DR
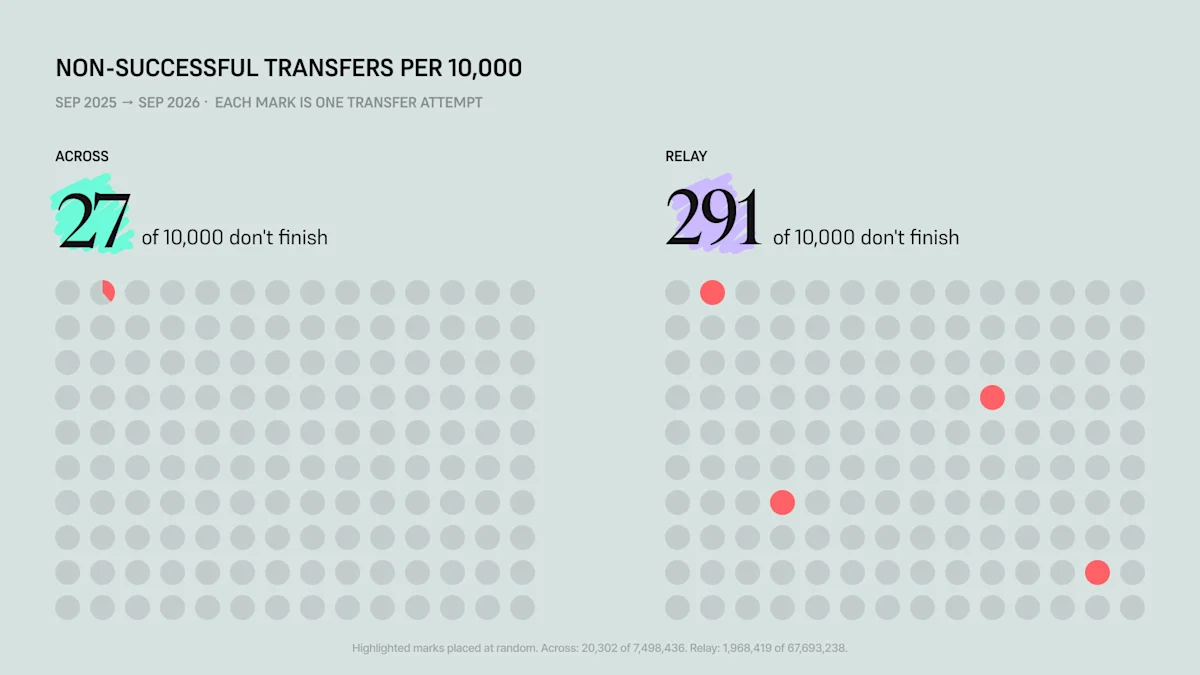
Between September 2025 and September 2026, the Across revert rate was 0.271%. The Relay revert rate was 2.909%. That is 27 non-completed transfers per 10,000 on Across against 291 on Relay.
Measured as a bridge success rate: Across 99.729%, Relay 97.091%.
Across’s worst month (0.62%, July 2026) was still lower than Relay’s best month (1.54%, May 2026).
Controlling for route mix on the 231 routes both bridges serve at volume, Relay’s rate falls to 2.25% and Across’s to 0.257%. Route mix explains about a quarter of the gap. The remaining 8.8x is about the protocols.
Bridge with Across → https://across.to/
Speed only matters if you actually cross the finish line.
A transfer that does not arrive is not a slow transfer. It is a support ticket, a position you could not open, a missed opportunity, a payment the person on the other end is still waiting for.
Most bridges advertise speed. We spent a lot of time talking about speed in the past as well, but speed is mostly a solved problem today. What’s most important when speed is solved for? Reliability. Over a full year of production traffic, reliability is where the Across vs Relay comparison stops being close. Between 8 September 2025 and 7 September 2026, 0.271% of crosschain transfers started through Across did not complete, against 2.909% through Relay.
There is nothing slower than a bridge that sends you back where you started.
Across vs Relay Revert Rate: The Headline Numbers
A revert, for this comparison, is any crosschain transfer that did not end with funds arriving on the destination chain. That covers refunds, explicit failures, and transfers still unresolved at the measurement date, 9 September 2026. The denominator is every attempt with real origin-transaction evidence behind it, so unexecuted quotes and abandoned API calls are excluded on both sides.
Route Mix Does Not Explain the Gap
The obvious objection is that the two bridges carry different traffic, and it is a fair one. Relay moves very large Solana and Robinhood volume, and Relay’s refunds concentrate there: 57% of its refunds over the year originated on Solana, and the single Solana to Robinhood route accounts for 32% of every refund Relay issued. A raw portfolio average compares route mixes as much as protocols.
So control for it. Take the 231 directional routes where both bridges moved at least a thousand transfers, measure Across on those routes, then reweight Relay’s revert rate to Across’s actual traffic distribution across the same routes.
Revert rate | Across | Relay |
Raw, all routes | 0.271% | 2.909% |
Route-matched, reweighted to Across’s traffic mix (231 routes) | 0.257% | 2.25% |
Route mix accounts for roughly a quarter of the difference. After controlling for it, Relay’s revert rate is still 8.8 times higher than Across’s. That remainder is the part that is about the protocols, not the traffic.
Across’ Worst Month Beat Relay’s Best Month
A year-long average can hide a bad quarter. Here is every month in the window.
Month | Across revert rate | Relay revert rate |
Sep 2025 (partial, from the 8th) | 0.31% | 5.40% |
Oct 2025 | 0.13% | 3.00% |
Nov 2025 | 0.11% | 1.87% |
Dec 2025 | 0.52% | 2.01% |
Jan 2026 | 0.35% | 2.64% |
Feb 2026 | 0.14% | 2.03% |
Mar 2026 | 0.22% | 1.61% |
Apr 2026 | 0.12% | 1.77% |
May 2026 | 0.22% | 1.54% |
Jun 2026 | 0.56% | 2.29% |
Jul 2026 | 0.62% | 3.42% |
Aug 2026 | 0.10% | 3.10% |
Sep 2026 (partial, through the 7th) | 0.12% | 3.33% |
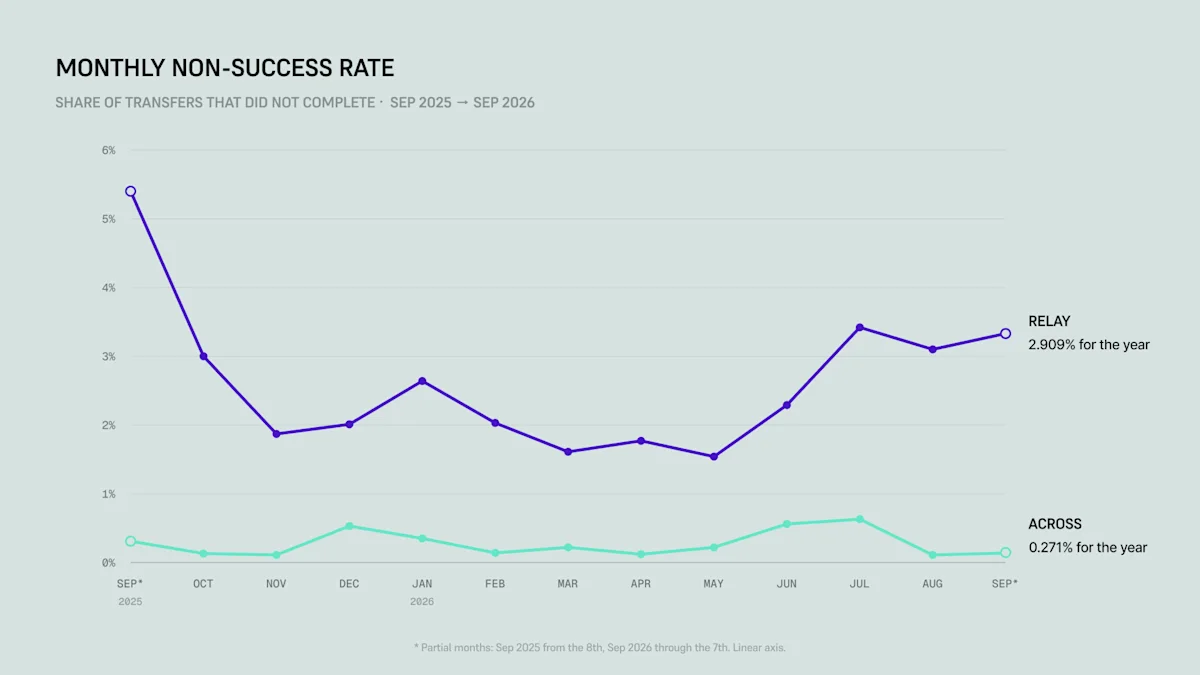
Across ranged between 0.10% and 0.62%. Relay ranged between 1.54% and 5.40%. Relay’s lowest monthly revert rate, 1.54% in May 2026, was 2.5 times Across’s highest, 0.62% in July 2026. There is no month in the series where the ordering flips, and in seven of thirteen months Relay’s rate was more than ten times Across’s.
Across vs Relay Reliability: Quick Answers
Which bridge has the lower revert rate, Across or Relay?
Across. Over the twelve months from 8 September 2025 to 7 September 2026, the Across revert rate was 0.271% and the Relay revert rate was 2.909%.
What is the Across bridge success rate?
99.729% of crosschain transfers attempted through Across Protocol completed over the measurement year, based on 7,498,533 attempts.
What is the Relay bridge success rate?
97.091% of crosschain transfers attempted through Relay completed over the same period, based on 67,697,368 attempts.
Does Relay’s higher failure rate come from its Solana traffic?
Partly. Reweighting Relay to Across’s route mix across 231 shared routes lowers Relay’s revert rate from 2.909% to 2.25%. Across’s rate on the same routes is 0.257%. Relay’s route-matched revert rate is still 8.8 times higher.
Is the gap consistent month to month?
Yes. In all thirteen months measured, Across’s revert rate was lower than Relay’s. Across’s worst month (0.62%) was lower than Relay’s best month (1.54%).
Bridge with Across: across.to